Aim Texas
  • Home
  • About
  • Services
    • Water & Environment
    • Planning & Economics
    • GIS & IT
    • Industry & Energy
    • Project Development
    • Engineering & Supervising
    • Inspection & Assessment
    • Master Planning
    • Marine & Coastal Engineering
    • Air & Land Transport Network
  • Policy
  • News & Projects
  • Career
  • Contact Us

Blog

December 3, 2012

By: admin

Baku, Azerbaijan, December, 2012

The Solid Waste Collection Program Design Report (the Solid Waste CPDR) submitted in October, 2012 for the Greater Baku Area was reviewed by 22 ministries and four agencies of Government of Azerbaijan, and received positive comments by the ministries and agencies.

The report gives the forecasts on the waste generation in the Greater Baku Area. According to results of the forecasts conducted within the report, in terms of waste generation rates (WGRs) of combined residential and non-residential waste by districts (cities of Greater Baku Metroplex)), while the highest WGR that is in Sabail (1.66 kg/capita/day), the lowest WGRs (0.55 kg/capita/day) seem to be realized in Khazar, Garadagh and Sabunchu districts. While WGR for yard waste in Khazar district is three folds the one for sweeping waste, the ratio of sweeping waste to yard waste is approximately one tenth in Nasimi district. In terms of waste generation by districts, including area cleaning waste, Nasimi contributes the largest proportion of waste generated – 11.54% or 213,371 tons per annum. Khatai produces fairly similar proportion of waste generated – 11.46% or 211,994 tons per annum.

However, it is worth to note despite Khazar seems to produce fairly similar proportion of waste (201,818 tons per annum) to those produced in Nasimi and Kahatai districts, 73.90% (149,148 tons per annum) of waste generated in Khazar is area cleaning waste as it has the largest proportion of city greeneries.

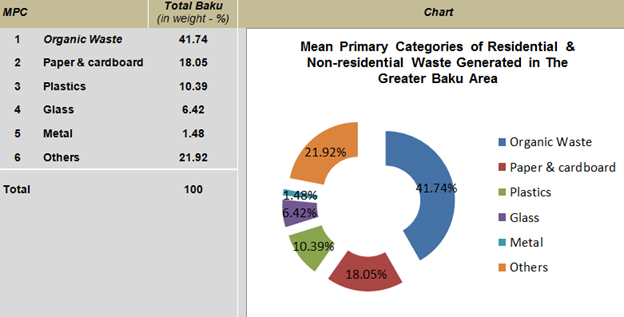
Also, the ratios of MPC in the Residential and Non-residential waste generated in the city are given in the following Table and Chart. Approximately 41.74% of residential & non-residential waste consists of compostable organics, 18.05% consists of paper/cardboard, and 10.39% consists of plastics. Collectively, these primary waste categories account for 70.18% of total residential and non-residential waste generated in the city. The fourth and fifth main waste composition categories are glass (6.42%) and metals (1.48%) are non-compostable.

n3

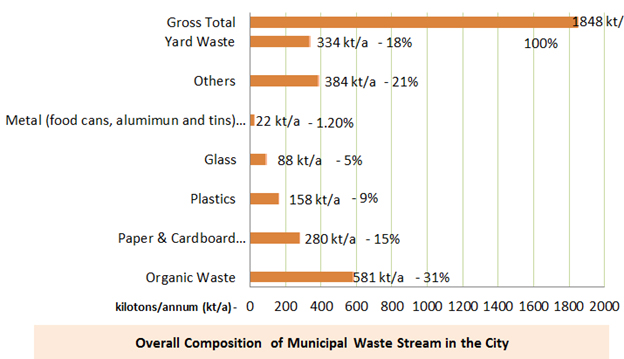
Approximately 31.42% of MSW (including sweeping waste and yard waste) generated in the city consists of compostable organics, 15.15% consists of paper / cardboard, and 8.57% consists of plastics. Collectively, these primary waste categories account for 55.14% of total MSW generated in the city. The fourth and fifth main waste composition categories are glass (4.78%) and metals (1.20%) are non-compostable.

n4

Posted in News
Previous Post
Next Post

  • June 2023
  • April 2023
  • March 2023
  • February 2023
  • January 2023
  • December 2022
  • November 2022
  • October 2022
  • September 2022
  • August 2022
  • July 2022
  • May 2022
  • December 2021
  • September 2021
  • August 2021
  • June 2021
  • May 2021
  • March 2021
  • February 2021
  • January 2021
  • December 2020
  • November 2020
  • October 2020
  • September 2020
  • August 2020
  • May 2020
  • April 2020
  • March 2020
  • February 2020
  • January 2020
  • October 2019
  • September 2019
  • August 2019
  • July 2019
  • June 2019
  • May 2019
  • April 2019
  • March 2019
  • February 2019
  • January 2019
  • December 2018
  • November 2018
  • October 2018
  • September 2018
  • July 2018
  • June 2018
  • February 2018
  • December 2017
  • November 2017
  • October 2017
  • August 2017
  • April 2017
  • November 2016
  • October 2016
  • September 2016
  • July 2016
  • June 2016
  • May 2016
  • April 2016
  • March 2016
  • February 2016
  • January 2016
  • December 2015
  • November 2015
  • October 2015
  • September 2015
  • August 2015
  • June 2015
  • May 2015
  • April 2015
  • March 2015
  • December 2014
  • October 2014
  • September 2014
  • August 2014
  • June 2014
  • January 2014
  • November 2013
  • August 2013
  • July 2013
  • May 2013
  • January 2013
  • December 2012
  • October 2012
  • August 2012
  • June 2012
  • May 2012
  • April 2012

“Aim Texas Trading, LLC”

Head Office
Dallas, TX, USA | [email protected]

  • Home
  • About Us
  • News & Projects
  • Services
  • Policy
  • Contact Us

FIELDS OF ACTIVITIES

  • Waste Management
  • Water Supply & Wastewater
  • Master Planning, Architecture
  • Transport Network Development
  • Agro-business & Irrigation
Aim Texas © 2025 All Rights Reserved.

Search